Storage Access with Grafana
Grafana has many options for importing data. We recommend using the JSON API data source for Grafana which is used for loading JSON data from REST APIs into Grafana.
The OpenBiotech Dashboard displays your API Keys.
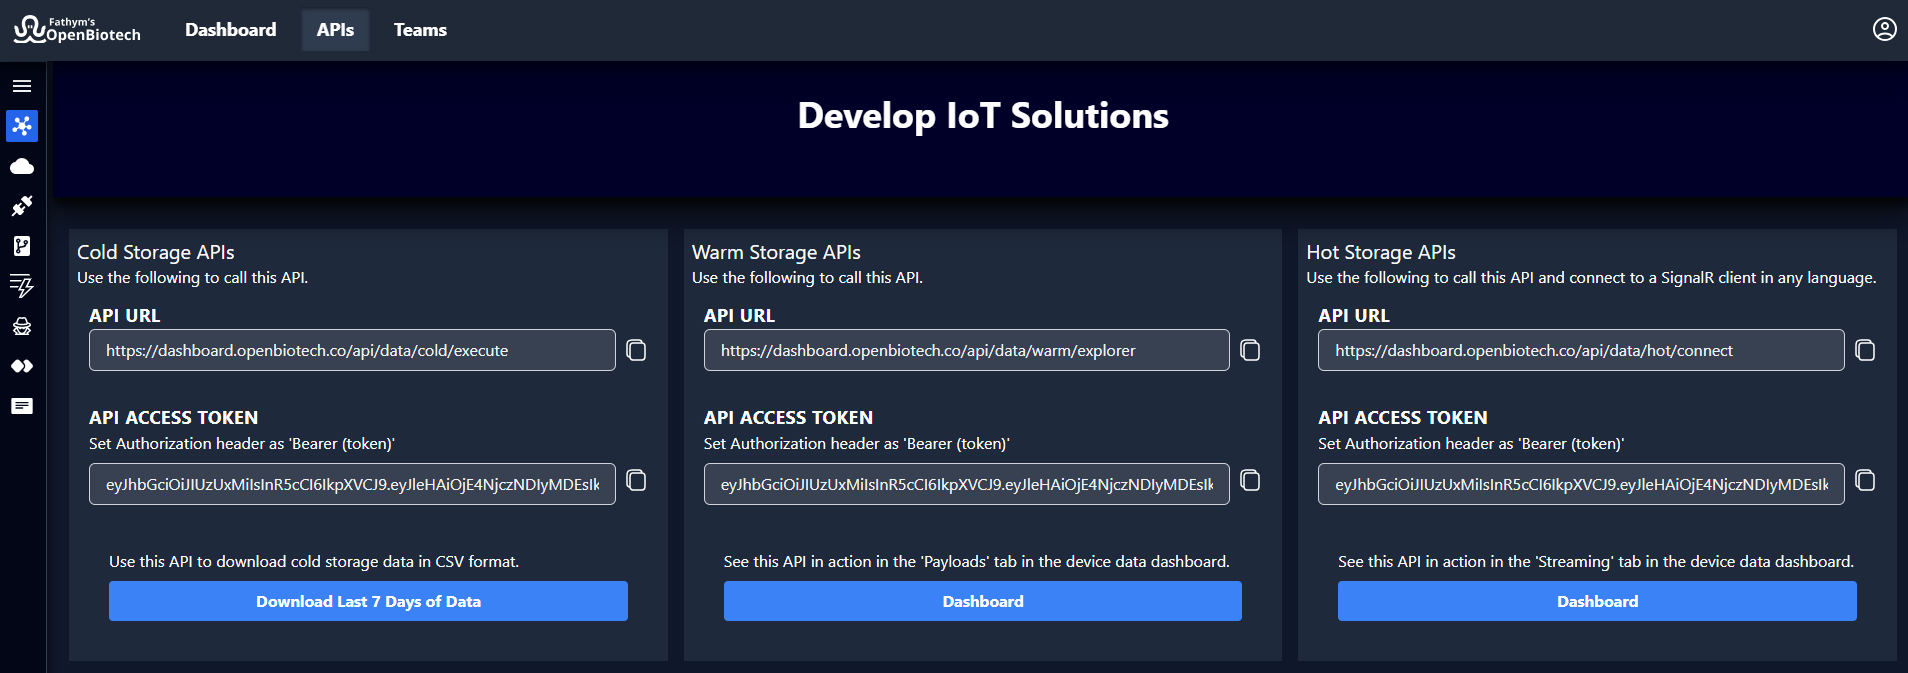
For the Cold Query, use this URL:
https://dashboard.openbiotech.co/api/data/cold/execute
For the Warm Query, use this URL:
https://dashboard.openbiotech.co/api/data/warm/explorer
Configuring Grafana Data Source
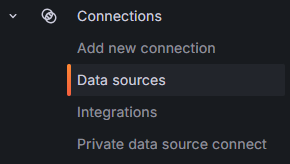
From the Grafana Home, click on Connections > Data Sources.
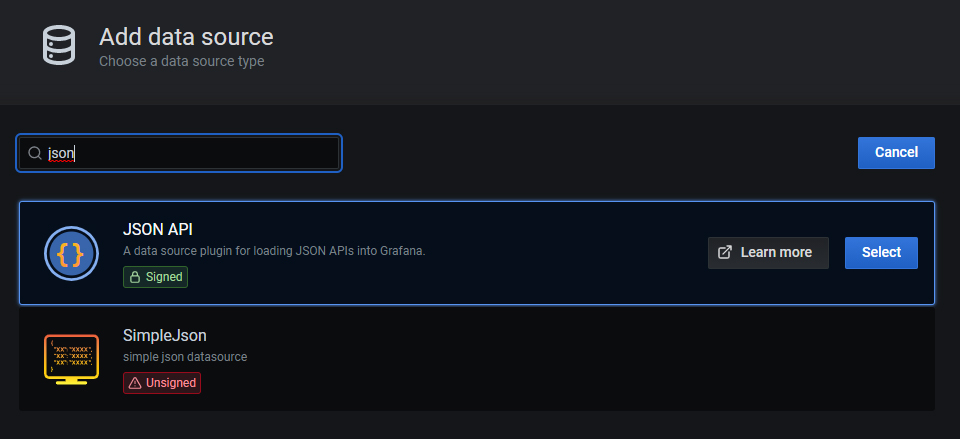
Click the 'Add new data source' button and search for 'json'. Select the 'JSON API' plugin.
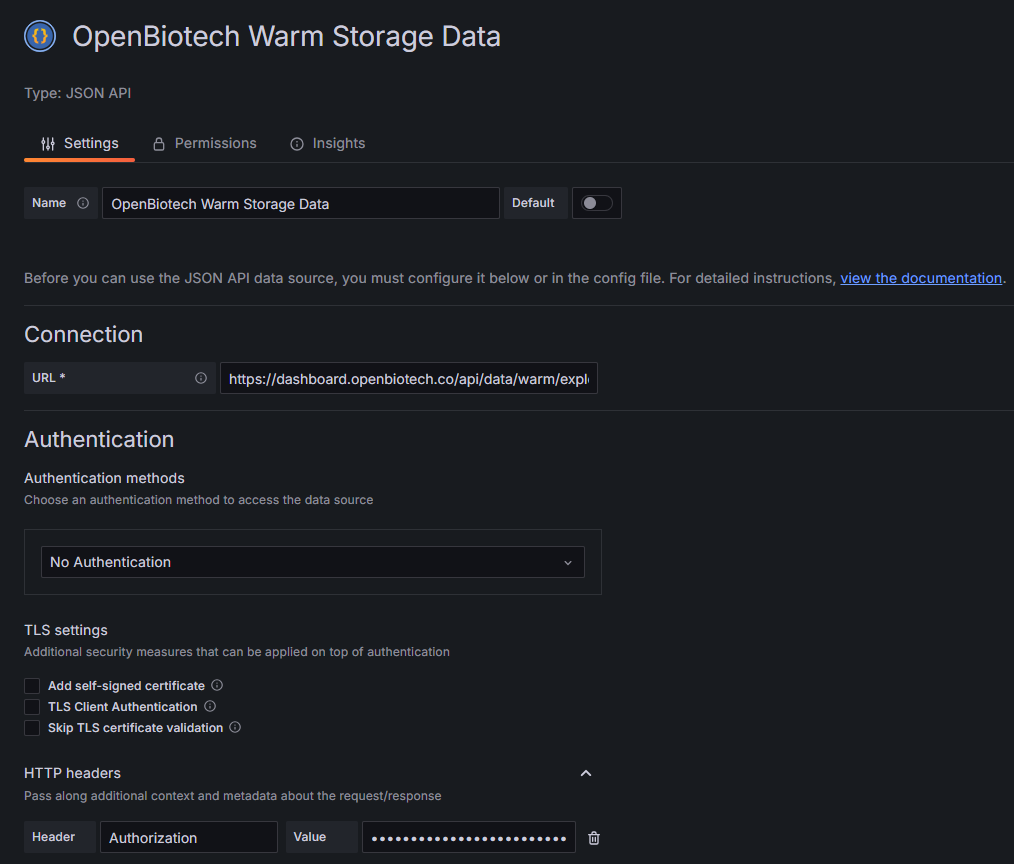
This example uses the Warm Query. Use the following values in the form:
- URL:
https://dashboard.openbiotech.co/api/data/warm/explorer - Auth:
No Authentication - Custom HTTP Headers:
Authorization: Bearer ***********
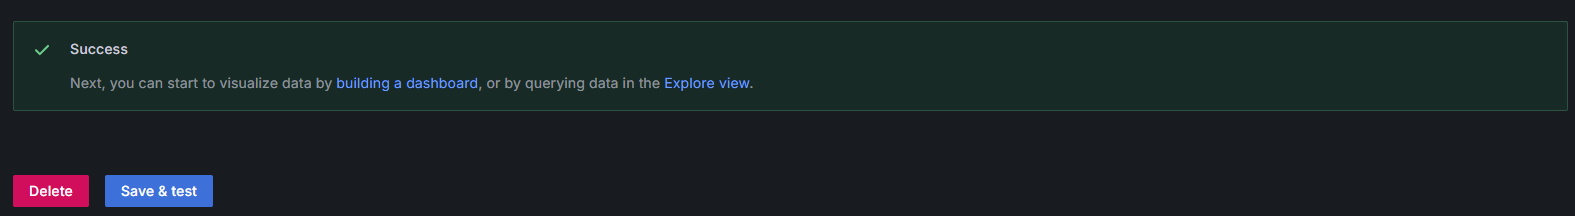
Click the 'Save & Test' button to verify the connection is successful. It should say 'Success' like the screenshot above.
Create a Grafana Dashboard
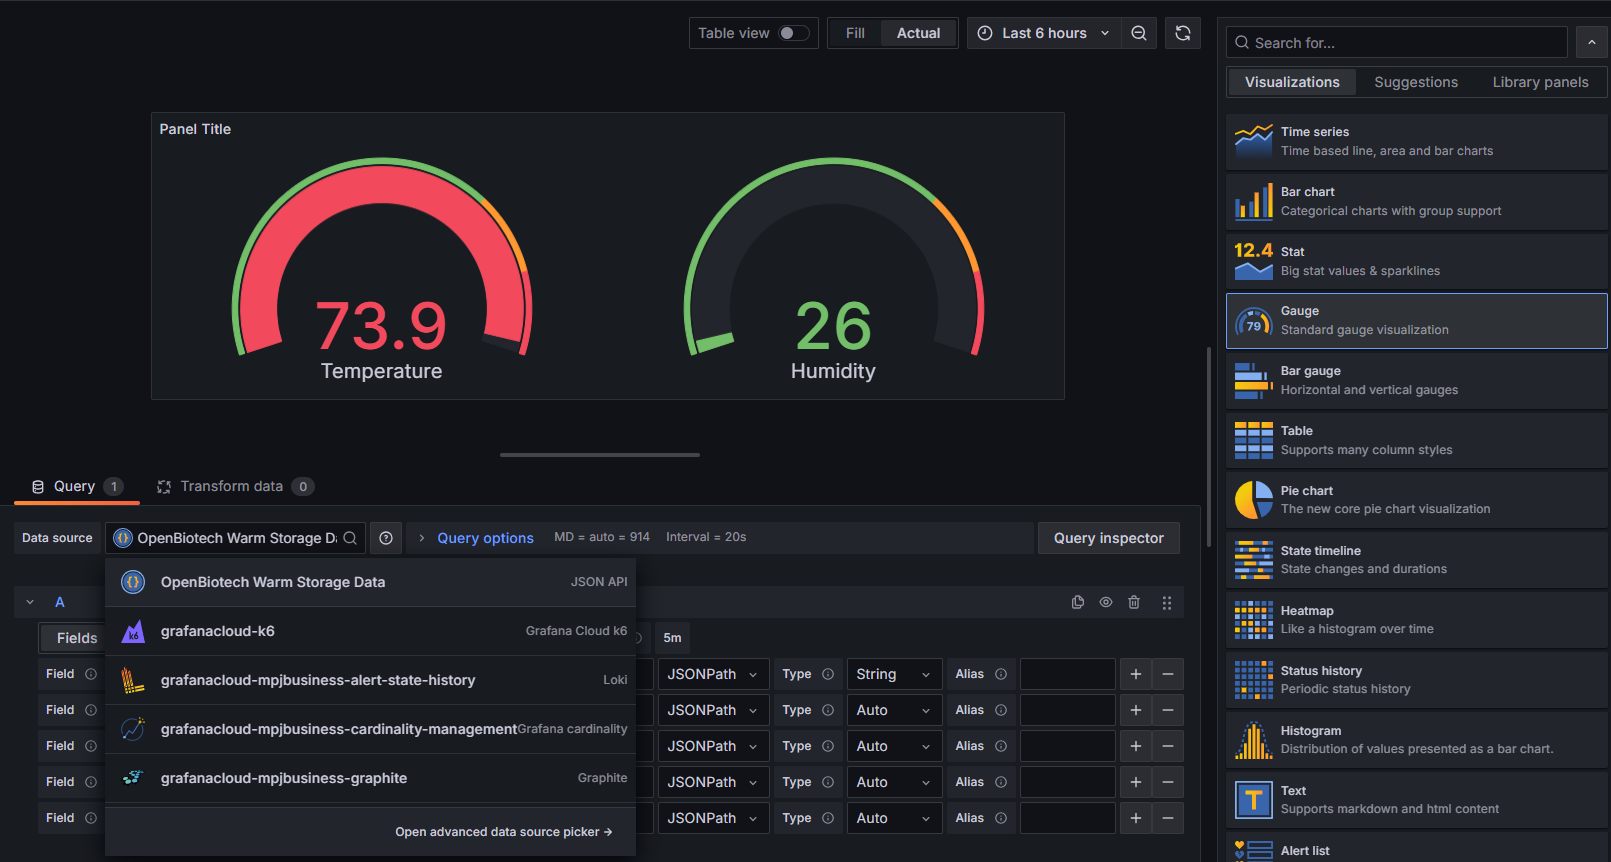
Create a new dashboard and Add Visualization . For the data source, select the one you added above.
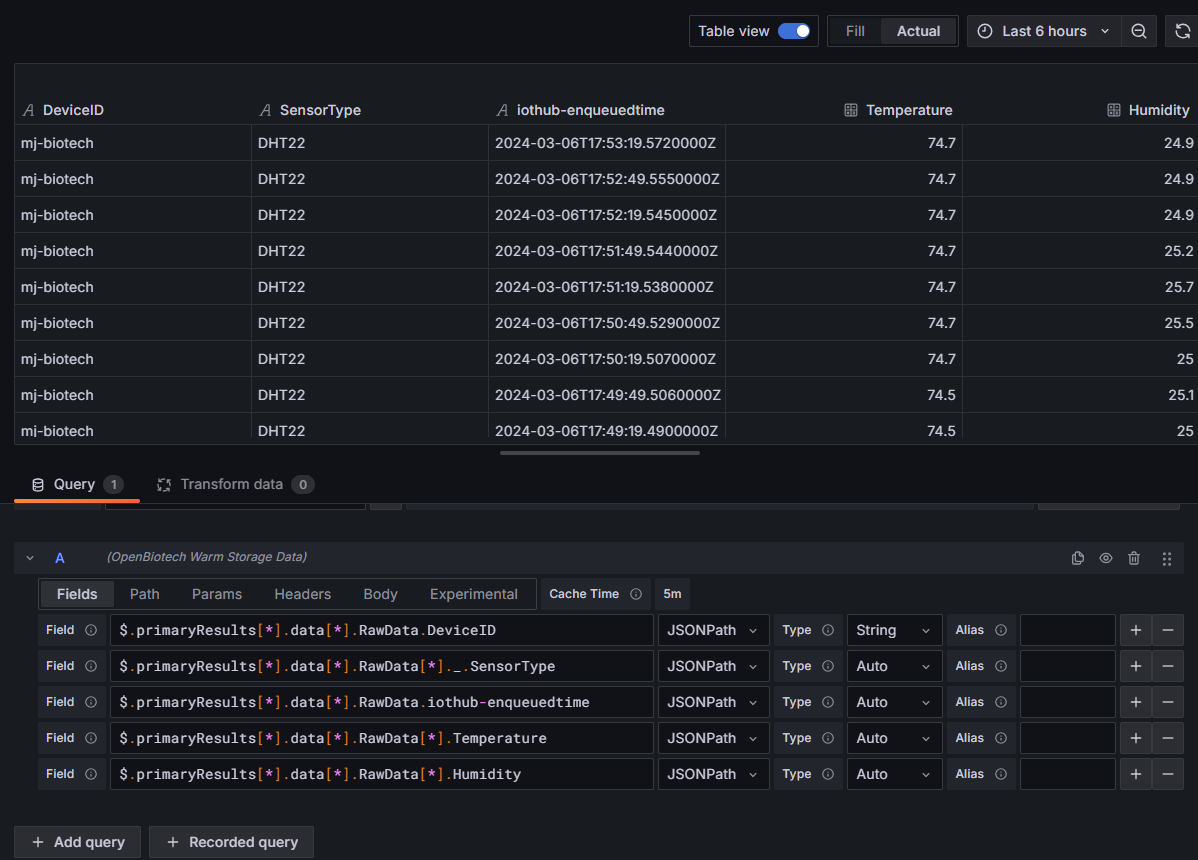
Switch to the Table visualization to easily view the raw data from storage. Use the screenshot below as a reference for how to access the device properties.
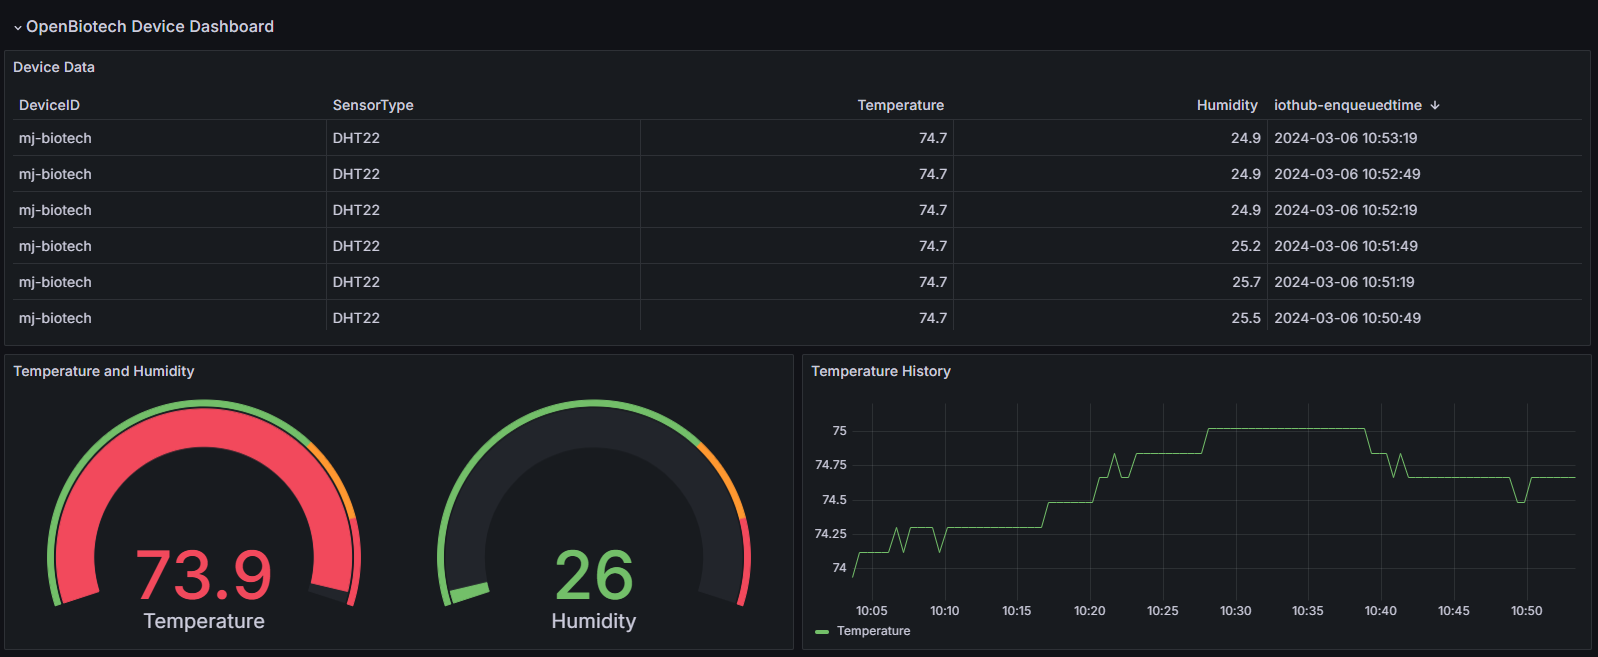
Success! Now that your data is loaded into Grafana, you can build dashboards like this: