Device Data Dashboard Overview
Once you have completed the getting started workflow you will land in the Device Data Dashboard. The device data dashboard is a turnkey dashboard that provides immediate access for exploring the device data (whether real or simulated) that was configured in the getting started workflow or for any additional devices that are connected to OpenBiotech.
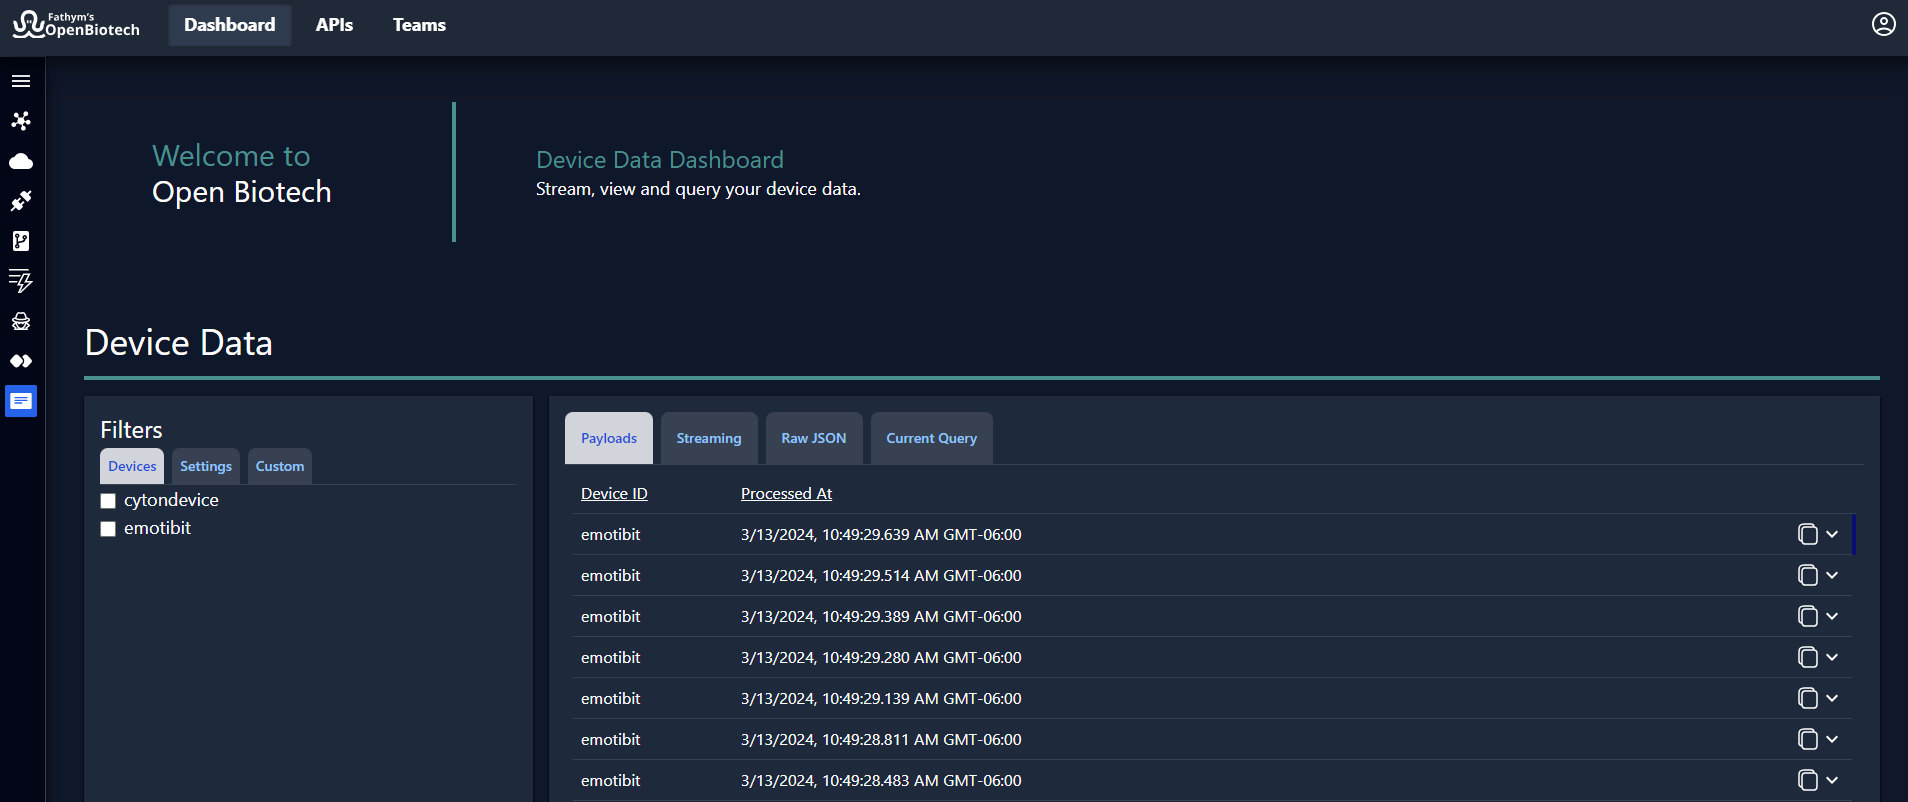
The dashboard leverages the cloud infrastructure, APIs, services and device data flows that were configured in the getting started workflow. For example, Azure Data Explorer is being used to process and filter device data (wither real or simulated) that is flowing in from Azure IoT Hub. The warm storage API powers the payloads and raw JSON tabs, while the hot storage API streams near real-time data into the streaming tab.
For information on how to use APIs to send data to third-party services downstream, check out the integrations section.
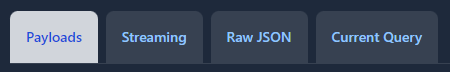
The are four dashboard tabs:
- Payloads
- Streaming
- Raw JSON
- Current Query
1. Payloads
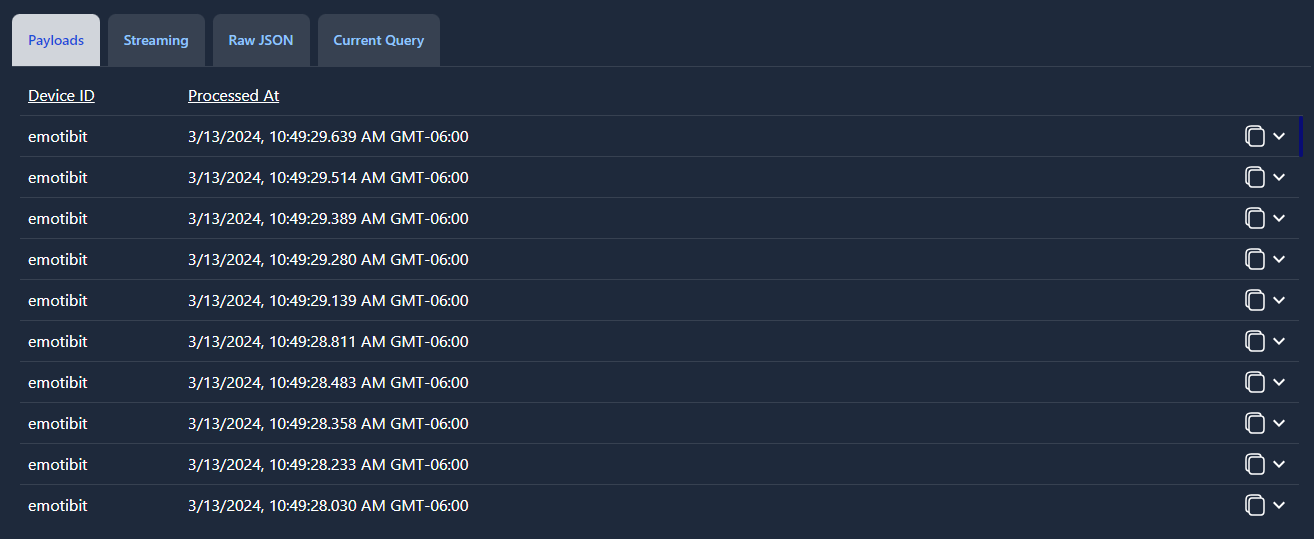
Payloads are the messages of telemetry, time-series data that flow from devices to the cloud. The payload data is from devices registered on Azure IoT Hub, whether simulated IoT Hub data to test out the system or real devices connected and streaming data to the cloud.
Each message is labeled with a Device ID (the name of the device registered on Azure IoT Hub, in this case ‘emotibit’) and the exact time and date that the payload was processed at (for example, 13/03/2024, 17:49:29.639 GMT+01:00). By default, OpenBiotech displays 100 rows of payloads at 30 second intervals, with the most recent payload at the top. Scroll down to view all displayed payloads.
Each payload has two buttons. 
Click  to copy the payload to your clipboard.
Click  to view the payload.
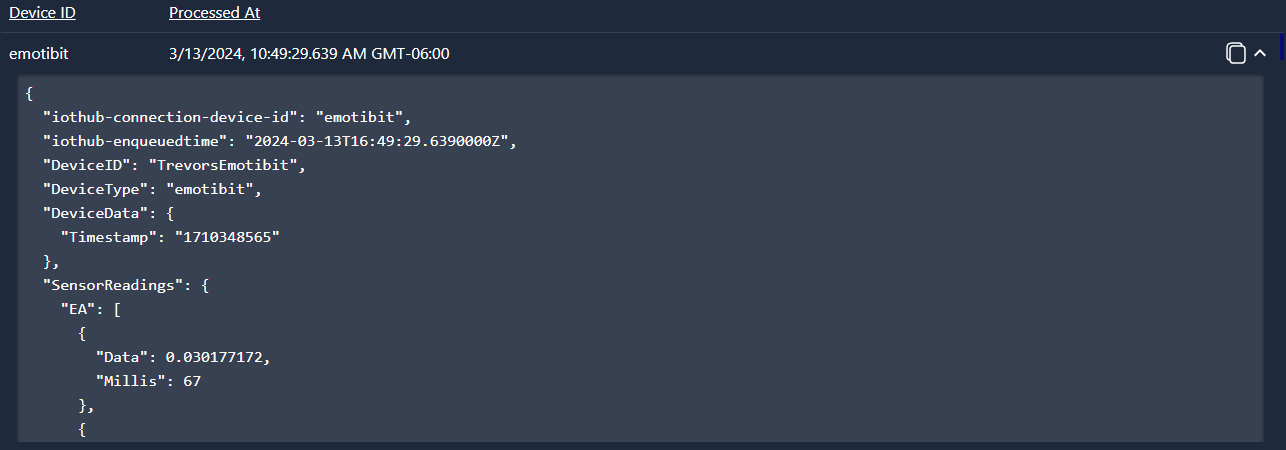
Payloads have some common components but are structured differently for each device.
For example, here is that payload for the EmotBit device in full:
{
  "iothub-connection-device-id": "emotibit",
  "iothub-enqueuedtime": "2024-03-13T16:49:29.6390000Z",
  "DeviceID": "TrevorsEmotibit",
  "DeviceType": "emotibit",
  "DeviceData": {
    "Timestamp": "1710348565"
  },
  "SensorReadings": {
    "EA": [
      {
        "Data": 0.030177172,
        "Millis": 67
      },
      {
        "Data": 0.030177172,
        "Millis": 134
      }
    ],
    "EL": [
      {
        "Data": 26543,
        "Millis": 67
      },
      {
        "Data": 26543,
        "Millis": 134
      }
    ],
    "PI": [
      {
        "Data": 6686,
        "Millis": 40
      },
      {
        "Data": 6686,
        "Millis": 80
      },
      {
        "Data": 6680,
        "Millis": 120
      }
    ],
    "PR": [
      {
        "Data": 8234,
        "Millis": 39.66666794
      },
      {
        "Data": 8228,
        "Millis": 79.33333588
      },
      {
        "Data": 8248,
        "Millis": 119
      }
    ],
    "PG": [
      {
        "Data": 1308,
        "Millis": 39.66666794
      },
      {
        "Data": 1318,
        "Millis": 79.33333588
      },
      {
        "Data": 1322,
        "Millis": 119
      }
    ],
    "TH": [
      {
        "Data": 22.1344986,
        "Millis": 134
      }
    ]
  },
  "SensorMetadata": {
    "BatteryPercentage": 79,
    "MACAddress": "XX:XX:XX:XX:XX:XX",
    "EmotibitVersion": "V01b"
  }
}
As you can see, the payload consists of an IoT Hub connection device ID, IoT Hub payload processing time, device type, device ID and timestamp. Following that are the various sensor readings and the payload concludes with the sensor metadata (such as battery percentage and EmotiBit version).
For contrast, here is a payload for a Cyton device:
{
  "iothub-connection-device-id": "cytondevice",
  "iothub-enqueuedtime": "2024-03-06T20:36:27.7330000Z",
  "timestamp": "2024-03-06T20:36:22.0590000Z",
  "DeviceID": "CytonBoard",
  "DeviceType": "EEG",
  "Version": "1.0",
  "SensorReadings": {
    "1": "-5618.334486285983",
    "2": "4935.019306542791",
    "3": "-5708.814347841067",
    "4": "4990.563391514229",
    "5": "-113784.5055800087",
    "6": "-83975.88389824437",
    "7": "-93837.74177285931",
    "8": "-99726.57707054343"
  }
}
2. Streaming
The streaming tab displays near real-time data streaming from a connected device to the cloud.
To do this the hot storage API must be provisioned, and a device must be connected and actively sending data to the cloud. However, while it is very useful to be able to view and examine device data in real-time, this can be expensive if left untouched for extended periods of time. Therefore, it is advisable to carefully manage the hot API and any connected devices.
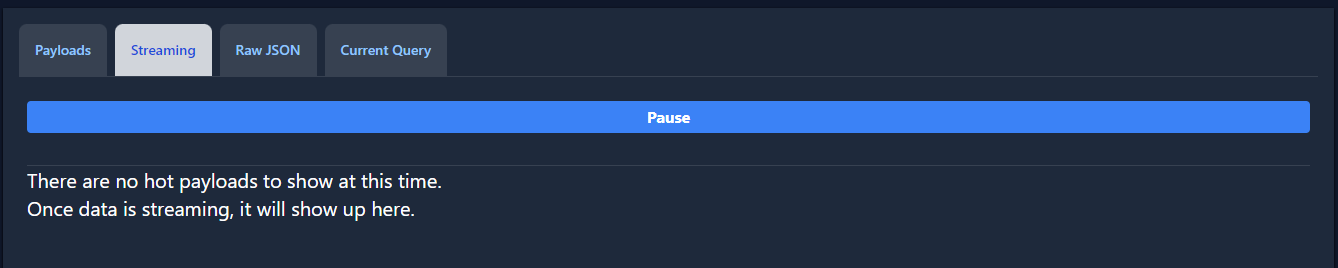
Bearing that in mind, by default the streaming tab should look like this:
When real-time data is streaming, the tab will look like this, with payloads that can be copied or viewed in full, just like the payloads tab.
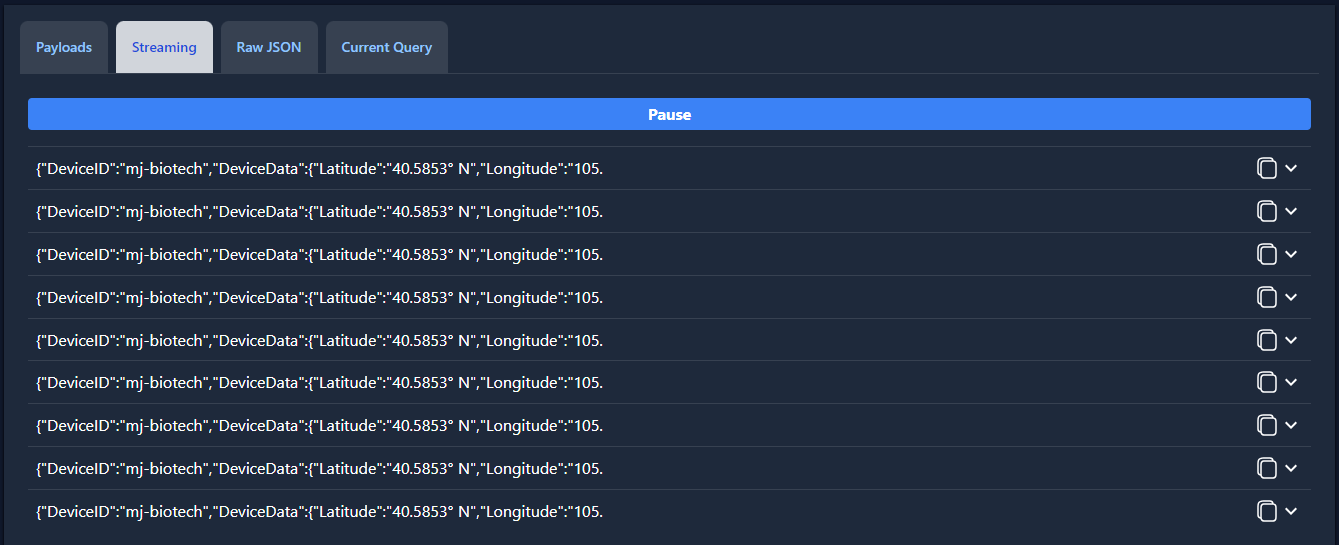
Data streaming can be halted at any moment with the pause button:

3. Raw JSON
Like the payloads tab, the raw JSON tab displays device data powered by the warm storage API, but in this case in raw JSON format. This takes the form of a continuous stream of the same device telemetry data found in the payloads tab.
For example, here is the equivalent payload that we just examined for the payload tab.
{
    "DeviceID": "emotibit",
    "EnqueuedTime": "2024-03-13T16:49:29.639Z",
    "MessageID": "",
    "RawData": {
      "iothub-connection-device-id": "emotibit",
      "iothub-enqueuedtime": "2024-03-13T16:49:29.6390000Z",
      "DeviceID": "TrevorsEmotibit",
      "DeviceType": "emotibit",
      "DeviceData": {
        "Timestamp": "1710348565"
      },
      "SensorReadings": {
        "EA": [
          {
            "Data": 0.030177172,
            "Millis": 67
          },
          {
            "Data": 0.030177172,
            "Millis": 134
          }
        ],
        "EL": [
          {
            "Data": 26543,
            "Millis": 67
          },
          {
            "Data": 26543,
            "Millis": 134
          }
        ],
        "PI": [
          {
            "Data": 6686,
            "Millis": 40
          },
          {
            "Data": 6686,
            "Millis": 80
          },
          {
            "Data": 6680,
            "Millis": 120
          }
        ],
        "PR": [
          {
            "Data": 8234,
            "Millis": 39.66666794
          },
          {
            "Data": 8228,
            "Millis": 79.33333588
          },
          {
            "Data": 8248,
            "Millis": 119
          }
        ],
        "PG": [
          {
            "Data": 1308,
            "Millis": 39.66666794
          },
          {
            "Data": 1318,
            "Millis": 79.33333588
          },
          {
            "Data": 1322,
            "Millis": 119
          }
        ],
        "TH": [
          {
            "Data": 22.1344986,
            "Millis": 134
          }
        ]
      },
      "SensorMetadata": {
        "BatteryPercentage": 79,
        "MACAddress": "XX:XX:XX:XX:XX:XX",
        "EmotibitVersion": "V01b"
      }
    }
  },
4. Current Query
This tab states how the current query is defined.
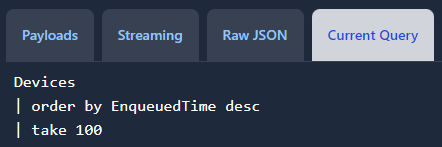
The default query states that 100 data records are displayed from all devices in descending order (so the most recent data record is displayed at the top) at 30 second intervals. In the next section, we will guide you on how to modify and update this query.
Filters
1. Devices
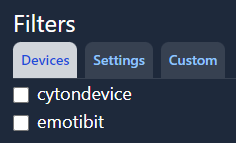
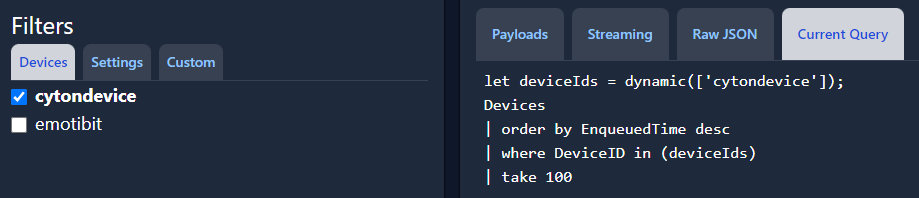
The devices filter determines which devices should be included in the query. The default query, with no boxes checked, includes data from all listed devices.
If the box for ‘cytondevice’ is checked, only data from the connected Cyton device will be included in the query and displayed in the dashboard. The query now looks like this.
2. Settings
The settings tab contains the following filters. These are the default settings.
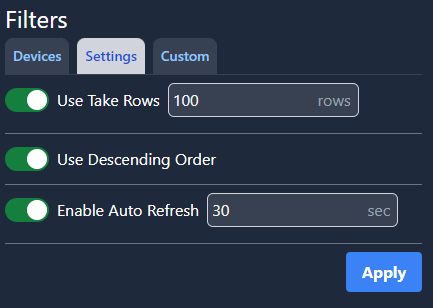
The ‘Use Take Rows’ setting determines how many data records are displayed, ‘Use Descending Order’ determines whether the most recent or oldest data records are displayed at the top, and ‘Enable Auto Refresh’ updates the dashboard with any new data records every 30 seconds.
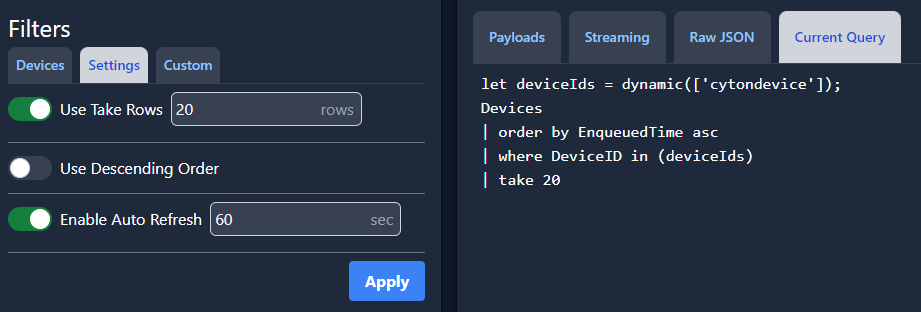
To modify the query, let’s set ‘Use Take Rows’ to 20 rows, toggle off ‘Use Descending Order’ and change ‘Enable Auto Refresh’ to 60 seconds. Click ‘Apply.’
This is how the query looks now:
And this is how the corresponding payloads tab looks:
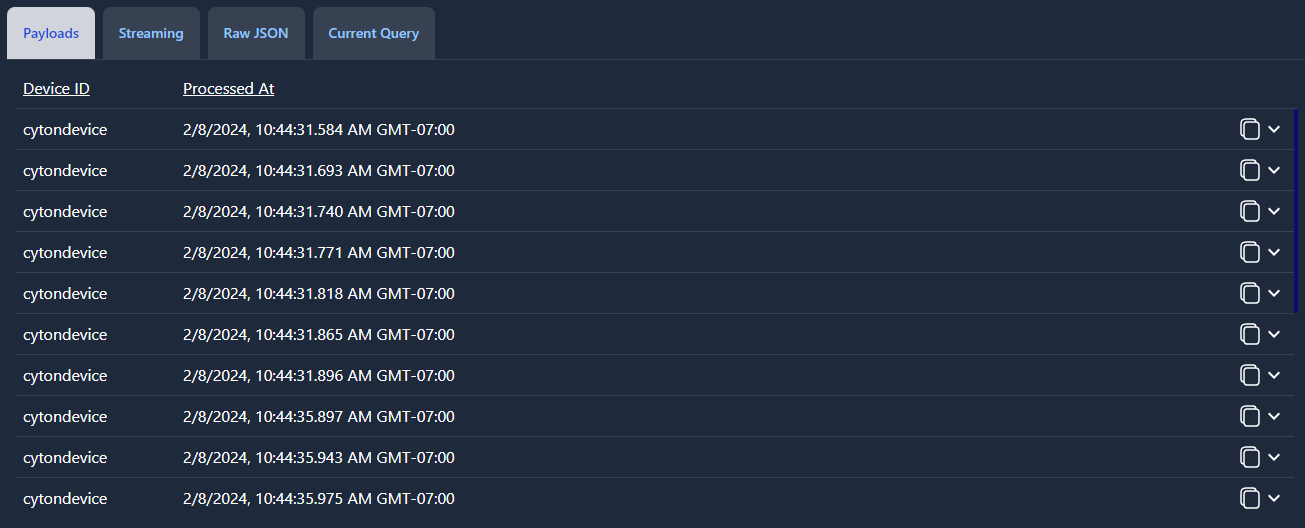
20 payload rows are displayed in ascending order (the oldest at the top) at 60 second intervals.
3. Custom Queries
The Device Data Dashboard allows you to manually modify your query using the Custom tab. This dashboard uses Kusto Query Language, or KQL. KQL does not modify data and is a read-only request language which is solely used to fetch, filter, analyze, and visualize data. It excels at handling large volumes of structured and semi-structured data, and it is particularly useful in Azure Data Explorer, where it enables fast, interactive analysis of huge amounts of data.
Learn more about how to use KQL here. Here is also a helpful cheat sheet if you're used to using SQL.