Managing OpenBiotech Dashboards
In the getting started workflow there is the opportunity to select and install default data dashboard services. These dashboard services provide an accessible, in-platform way to view and explore device data.
There are currently two dashboard services, one required and one optional:
Azure Data Explorer (required): Azure Data Explorer is an analytics service for real-time and time-series analysis on large volumes of data streams. Use it to quickly identify patterns, anomalies and trends in your data. Azure Data Explorer’s primary purpose is to power OpenBiotech’s turnkey Device Data Dashboard (this is why its installation is required), but you can also access and use Azure Data Explorer directly within the platform.
Freeboard (optional): Freeboard is an open-source, configurable dashboard for viewing real-time device data.
To access and manage these dashboard services from the OpenBiotech platform, view the sidebar to the left.
Select the ![]() button and the IoT section will expand.
button and the IoT section will expand.
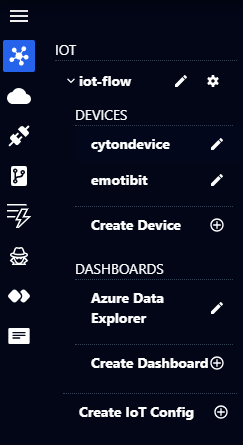
In the Dashboards part, you can access and load Azure Data Explorer’s interface by clicking the edit button beside it.
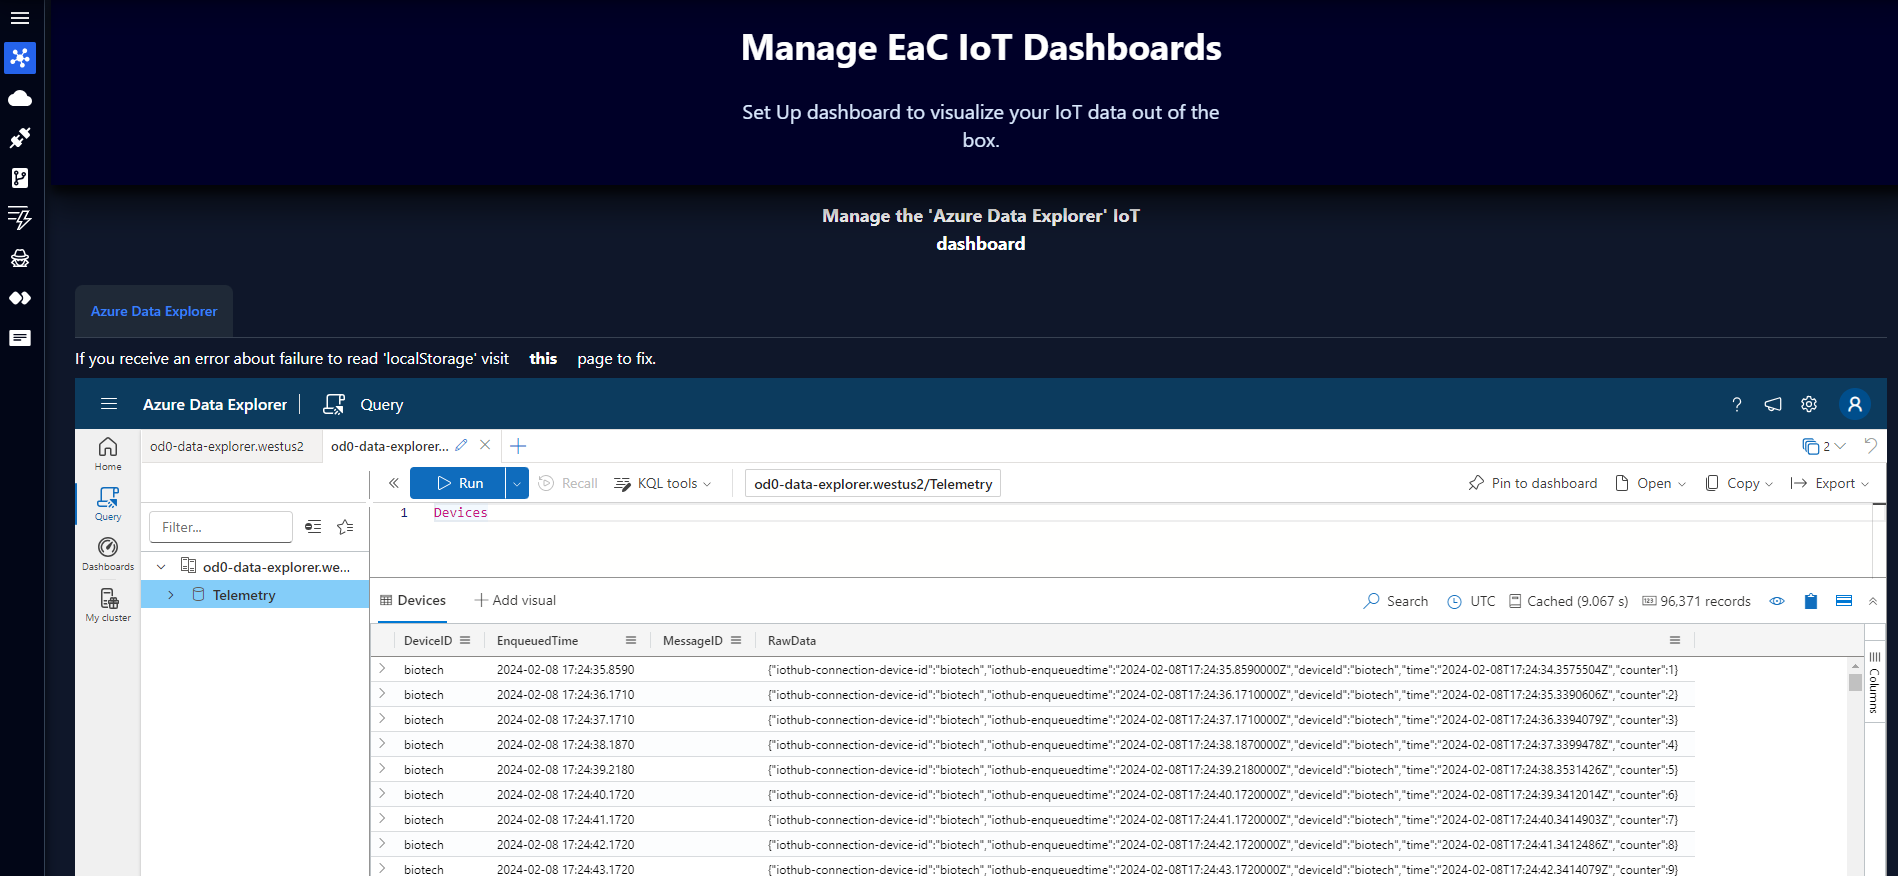
To start working with Azure Data Explorer, visit this Azure documentation.
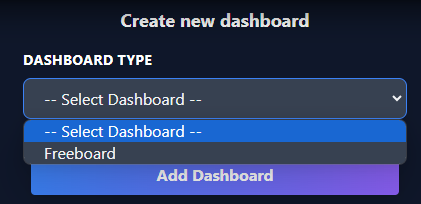
If Freeboard was installed in the getting started workflow it would also appear under Dashboards in the IoT sidebar. For this enterprise Freeboard is not yet installed, but if you wish to install it at any point, click on Create Dashboard.

From the Dashboard Type dropdown menu, select Freeboard (the only option currently) and then click Add Dashboard. Freeboard will now be installed on the platform.